What is Item-Response Theory?

What is an Argumentative Essay?
October 21, 2023
Add These 20 SAT Words to Your Arsenal
November 11, 2023Originally written by Mac Wetherbee and posted on: https://mindfish.com/blog/what-is-item-response-theory/
You have probably read about the SAT and PSAT going digital and including a computer-adaptive component starting in 2023 and 2024. What you may not know is that this change is made possible by a statistical technique known as Item-Response Theory (IRT).
IRT plays a critical role in standardized tests like the ACT and SAT. IRT is a framework of statistical models that allows researchers and test-makers to estimate individuals’ underlying abilities from a set of questions (called “items”).
We can measure some things directly: a person’s height, weight, eye color, etc. However, some variables are “latent,” meaning that we cannot directly measure or observe them. IRT provides a solution to this problem. These advanced statistical models allow latent constructs to be measured using a test made up of a series of questions.
How Item-Response Theory Works
The basic idea behind IRT is that the probability of a correct response to a certain question is based on three things: 1. The amount of ability that the student has, 2. The difficulty of the question, and 3. How effectively the question measures the underlying latent ability.
Statistical models based on IRT allow all three of these values to be estimated simultaneously: if we have a test with 60 questions (such as the ACT Math section) given to 1,000 students, the model will estimate a difficulty value for each of the 60 questions, a ‘slope’ or ‘discrimination’ value for each of the 60 questions (how effectively the question measures the underlying ability), and an “ability” level for each of the 1,000 students.
In its purest form, IRT could then simply use this estimated ability level as a score. However, in practice, most test-makers create their own unique scoring scales to translate a student’s ability level into a score that is meaningful to students and colleges (out of 36 for the ACT and out of 1600 for the SAT).
IRT is not a single statistical model—it is actually a family of models. One of the most commonly used variants is called the 3-parameter Logistic (3PL) Model. This is likely what ACT and SAT are using when developing their tests. The formula for this is somewhat complicated:

If this seems overly complex, don’t worry. The main thing to know is that once this formula is applied to multiple questions on the same test, the model can estimate each individual’s ability based on which questions he or she got right or wrong.
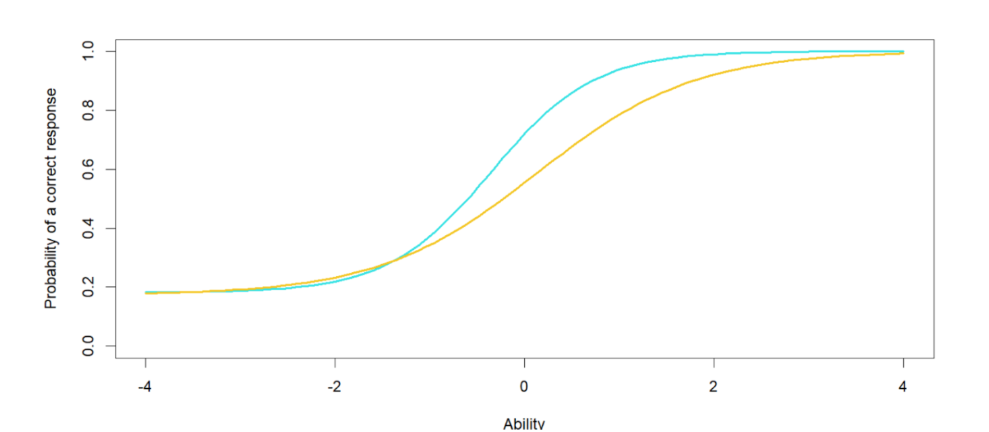
We can also use this type of model to look at how individual questions behave differently. For example, the graph below shows us two different questions. The yellow question is harder, as it requires a higher ability level to have a 50% chance of a correct answer. The blue question is easier, and it also has a greater slope (discrimination) value—it provides more information about how much ability the respondent has.

How Is IRT Different from Traditional Test Scoring?
Since elementary school, we have taken tests where our scores are determined by how many questions we answer correctly and/or how many “points” we receive. Typically, each question is worth the same number of points. In fact, the current versions of the ACT and SAT work this way too: for each test, a certain number of correct answers yields a particular score, regardless of which specific questions the student got right and wrong.
With true IRT scoring, however, two people could get the same number of questions correct but earn noticeably different scores. This may seem strange or even unfair to some people, but it has been shown by many academic research studies to be a more accurate and precise way of measuring individuals’ ability levels.
College Board has not explicitly stated that questions will no longer all be weighted the same, but that certainly seems to be the indication that they’re giving when they say, “By design, concordance and vertical scaling studies will establish the digital SAT scale, and the use of item response theory (IRT) and ability estimation will provide the basis for calculating scale scores in near real time” (source).
An Example
To demonstrate IRT, I simulated a 98-question test (the length of the digital SAT) with questions of varying difficulty, discrimination, and guessing parameters. I also simulated 1,000 students to take the test, all of varying ability levels. I then had each simulated person take the simulated test, and I applied the 3PL model to this dataset.
Let’s look at two students in this simulated scenario. We will call them Parker and Bailey. Parker got seven more questions correct than Bailey did. On a traditional test, Parker would earn the higher score, and most people would assume that Parker had a higher level of ability. However, Parker’s true ability level is actually quite a bit lower than Bailey’s: 27th percentile versus 54th percentile. Thus, if we used traditional test scoring, we would draw incorrect conclusions.

The IRT model, however, correctly identifies that Bailey actually has more ability than Parker does. This is a small example, but it demonstrates the ability for IRT scoring to measure the abilities of test-takers more accurately than more traditional scoring methods.
Consequences
ACT and SAT have used IRT models for many years to test their questions and create their scales. With the new digital SAT, College Board appears to be taking it one step further by using IRT scoring and allowing questions to be weighted differently. This allows the test to be shorter and (potentially) more effective at measuring students’ underlying abilities.


